Update (2011-08-02)
The Guardian has produced excellent new analysis on trends in the mobile device space as of Q2 2011:
Overview
SmartPhone use has expanded hugely in the past few years, spurred by the launch in 2008 of the iPhone App Store and subsequent rival phones such as Google’s Android and Microsoft’s Windows Phone 7.
However, when budgets are limited, web product owners can face a daunting task of deciding which SmartPhone device to support first. With market share changing so rapidly, this can be a difficult decision. The problem is further compounded by different SmartPhone use in different regions, so a US market might get an iPhone app, whereas a Russian market might get a Nokia app, and so on.
We’ve pulled together some statistics on SmartPhone use to help with these kinds of choices.
Visualisation
The excellent StatCounter website (gs.statcounter.com) provides a suite of useful tools for analysis of web use, including web browsing on mobile devices. This clearly cannot account for native app use, but it seems unlikely that the figures for mobile browsing are vastly different from what would be shown if native app data were available.
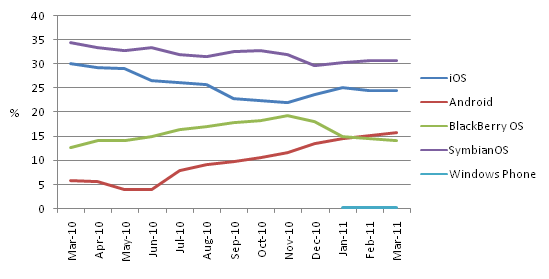
For example, we ran the “mobile browser” report for 2010-2011, and then plotted the results:

Here we can clearly see that, after a shaky start, the Android platform is doing very well, largely at the expense of Blackberry and perhaps iOS (iPhone/iPad devices). The curve for Symbian is interesting, as it appears to be retaining its market share, perhaps as its browser improves.
Geographical Differences
Different regions have different patterns of use. In the US, for instance, Blackberry is much more popular than in the the world as a whole, at least as determined by sales:
| Gartner | Canalys | ||||
| OS | Units (2010) | Share % | Units (Q4 2010) | Share % | |
| Symbian | 111576.7 | 37.6 | 31000.0 | 30.6 | |
| Android | 67224.5 | 22.7 | 33300.0 | 32.9 | |
| RiM | 47451.6 | 16.0 | 14600.0 | 14.4 | |
| iOS | 46598.3 | 15.7 | 16200.0 | 16.0 | |
| Windows | 12378.2 | 4.2 | 3100.0 | 3.1 | |
| Other | 11417.4 | 3.8 | 3000.0 | 3.0 | |
| TOTAL | 296646.7 | 100 | 101200.0 | 100 | |
| Comscore | Nielsen | ||
| OS | Total Share (%) | Sales Q4 ’10 (%) | |
| Symbian | 2 | ||
| Android | 31.2 | 29.0 | |
| RiM | 30.4 | 27.0 | |
| iOS | 24.7 | 27.0 | |
| Windows | 8.0 | 10.0 | |
| Other | 5.7 | 5.0 | |
| TOTAL | 100 |
However, the picture in the UK is different still, with Android extremely strong:
| OS | Sales Dec ’10 – Feb ’11 (%) |
| Android | 37.4 |
| RiM | 23.3 |
| iOS | 22 |
| Other | 17.3 |
| TOTAL | 100 |
The picture becomes more confused still when we analyse the different mobile devices across adjacent European countries:
| iOS (%) | Symbian (%) | Android (%) | RiM (%) | Windows Phone (%) | |
| DE | 57.95 | 7.71 | 23.09 | 0.62 | 1.07 |
| FR | 63.66 | 5.20 | 20.95 | 2.13 | 0.63 |
| IT | 47.84 | 27.39 | 12.74 | 1.35 | 0.69 |
| UK | 40.27 | 3.99 | 13.28 | 38.08 | 0.28 |
| USA | 39.01 | 1.52 | 31.83 | 20.66 | 0.53 |
| Worldwide | 24.38 | 30.61 | 15.80 | 14.10 | 0.28 |
There are huge differences between Germany (DE), France (FR), Italy (IT) and UK, with Blackberry very popular in the UK, but almost unused in France, Italy and Germany.
Conclusion
If your budget for mobile apps is limited, you should choose a SmartPhone type which is popular within the region or country of your market. Android and iPhone are strong across all markets, but Symbian (Nokia), RiM (Blackberry) and Windows Phone have variable market penetration.
The relative market share of each platform is likely to be very volatile, however, so it’s wise to review the trends every quarter and reassess your mobile strategy.
(Thanks to Chris Jennings for help with the statistics.)
References
[1] Gartner: http://www.gartner.com/
[2] Canalys: http://www.canalys.com/pr/2011/r2011013.html
[3] Nielsen: http://blog.nielsen.com/nielsenwire/online_mobile/who-is-winning-the-u-s-smartphone-battle
[4] http://www.kantarworldpanel.com/#/News/news-list/Android-dominates-the-smartphone-market
[5] StatCounter: http://gs.statcounter.com/#mobile_browser-ww-monthly-201103-201103-bar” This information was obtained under a Creative Commons license.
